AI Agents That Resolve Data Incidents for You, or Alongside You

DataSentry™ is GSPANN's AI incident response system for data platforms. Its agents investigate each incident ticket, then either apply a governed fix or hand your engineers the evidence.

Your on-call engineers triage hundreds of data-platform alerts a day, and much of that volume is noise. When a real failure gets through, someone digs through siloed tools for hours while the business works from stale numbers. DataSentry™ runs that response as a governed workflow, from ticket to verified fix.

Operating Modes

You Decide How Much It Does

Both modes use the same agents and runbooks, and write to the same audit trail. Start as a copilot to build trust, and move toward autonomy as the results earn it.

Autonomous Mode

Agents Resolve It End to End

Agents triage, investigate, apply a governed fix, and verify the outcome inside your policy limits. Engineers are pulled in only for what policy reserves for a person.

  • ✓ Noise filtered before it reaches anyone
  • ✓ Common incidents closed without human touch
  • ✓ A transient error with a matching runbook retries automatically
  • ✓ Approval gates still apply where policy requires them
Copilot Mode

Agents Assist, People Decide

Agents do the investigation and bring back the root cause with a recommended next step. Your engineers review it and decide what happens.

  • ✓ Classification with a confidence score
  • ✓ Evidence from job runs and logs, including the table schemas involved
  • ✓ A proposed fix for a person to approve
  • ✓ A handoff to a person whenever confidence falls below your threshold
How It Works

Five Steps, From Ticket to Resolution

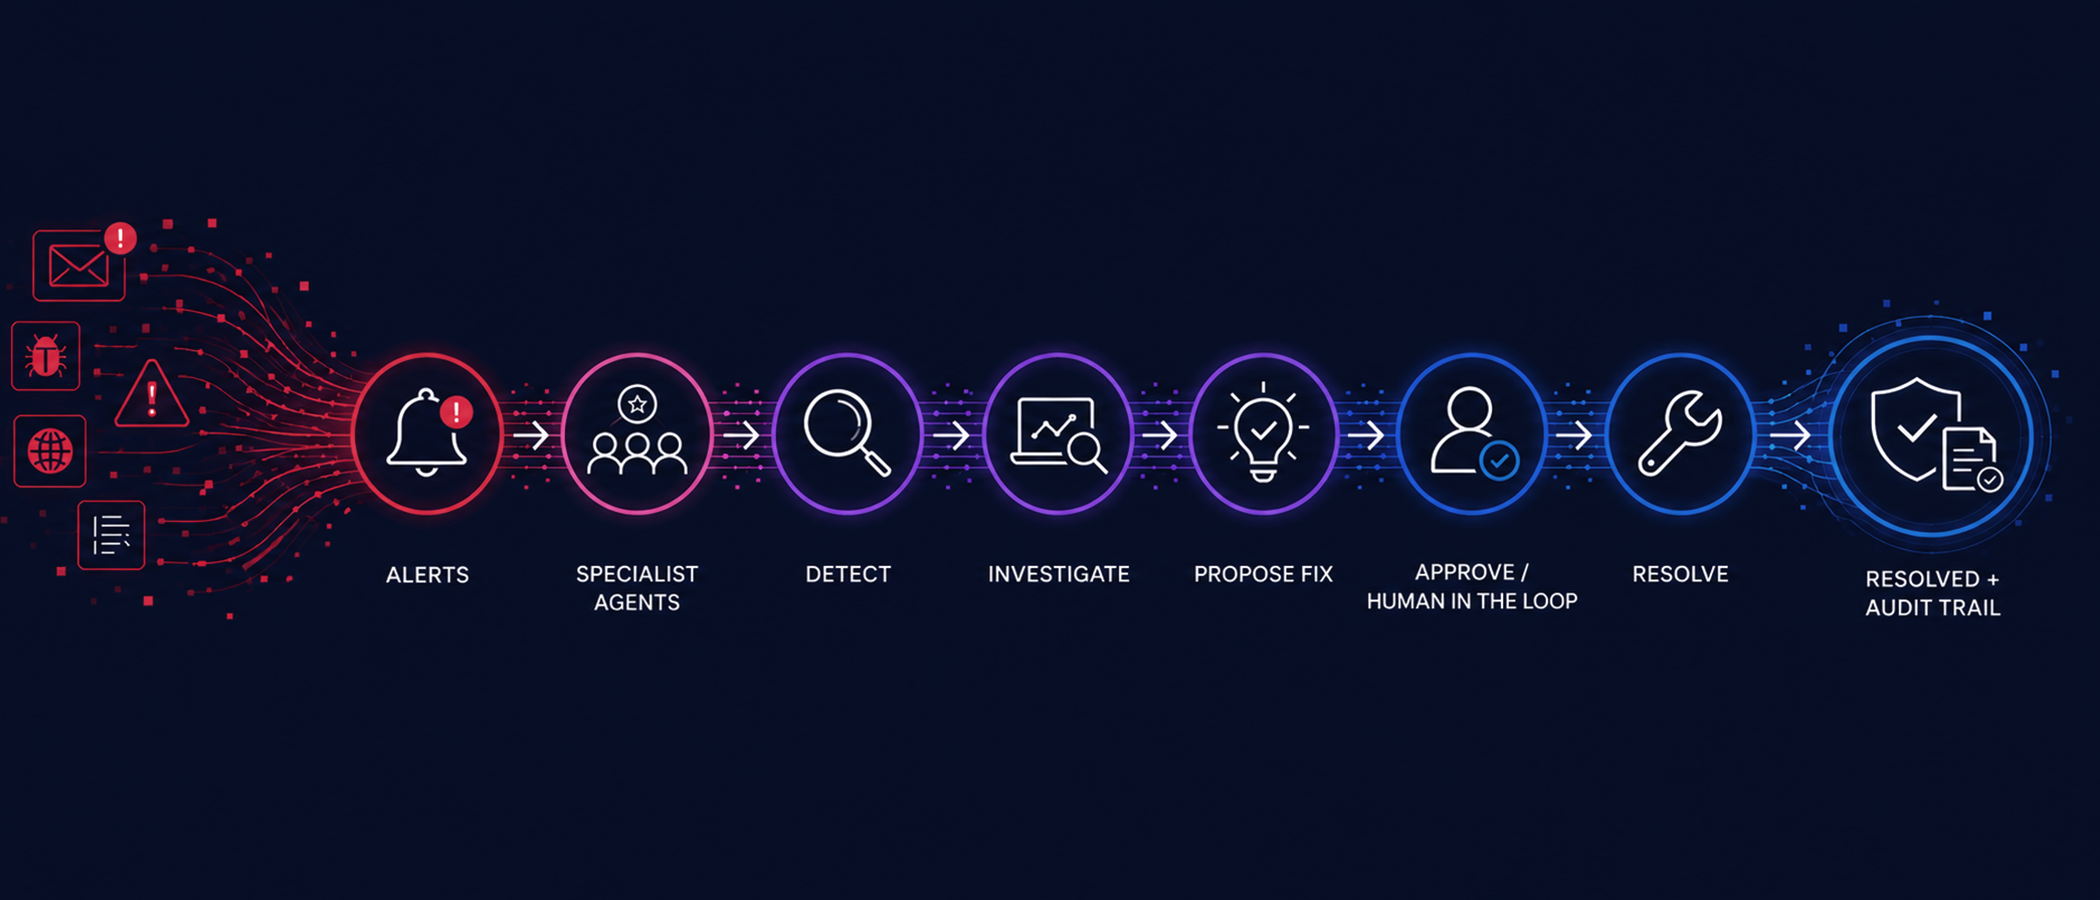
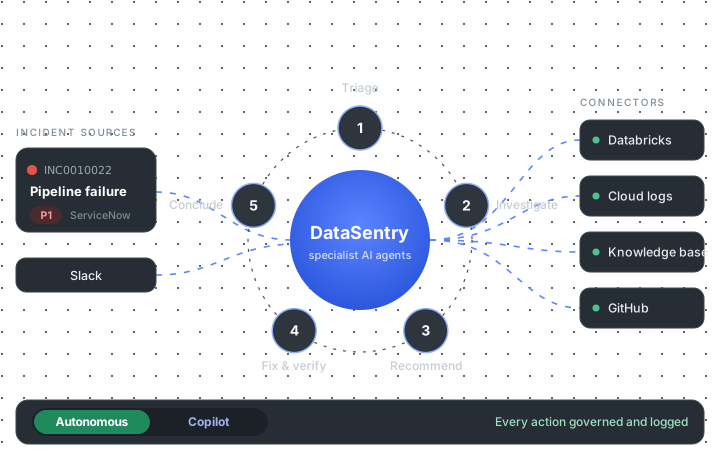
Each ticket follows the same codified workflow, with guardrails and a human in the loop where policy requires it.

Diagram: incident tickets from ServiceNow and Slack flow into DataSentry, where specialist agents run a five-step workflow (triage, investigate, recommend, fix and verify, conclude) using Databricks, cloud logs, the knowledge base, and GitHub. It runs autonomously or as a copilot, and every action is logged.
1

Triage

Normalizes the ticket and classifies it with a confidence score.

2

Investigate

Specialist agents read job runs, notebooks, cloud logs, and table schemas to find the root cause.

3

Recommend

Picks the next step from the evidence, such as a retry or a drafted code fix. When the evidence calls for a person, it escalates to L2.

4

Fix and Verify

Executes governed fixes and confirms the outcome before closing.

5

Conclude

Posts the root cause analysis to the ticket and keeps it in sync. If the case still needs a person, it routes to L2.

Example

A Pipeline Outage, Resolved End to End

An upstream column was renamed from event_timestamp to event_ts, but one downstream step was not updated. The Databricks job fails on every run, and the dashboards behind it go stale.

DataSentry classifies the ticket, finds the root cause, drafts the fix as a pull request, and waits for a person to merge it before verifying that the job succeeds. In the demo run shown on this page, the incident went from ticket to validated fix in 2 minutes 39 seconds.

Upstream column renamedDatabricks job failing
  1. ticket_intakeIncident opened from ServiceNow
  2. classificationpipeline_failure · confidence 0.95
  3. databricks_investigationRoot cause found in a notebook
  4. knowledge_runbookNo prior match in the knowledge base
  5. change_initiatorDrafts a one-line fix as a GitHub pull request
  6. human gateWorkflow pauses until a person merges the pull request
  7. remediationPulls the merged code and polls until the job succeeds
resolved end to endevery step logged
Product Screens

See Every Incident and Agent in One Console

Real screens from the DataSentry console. Click any screen to see it full size.

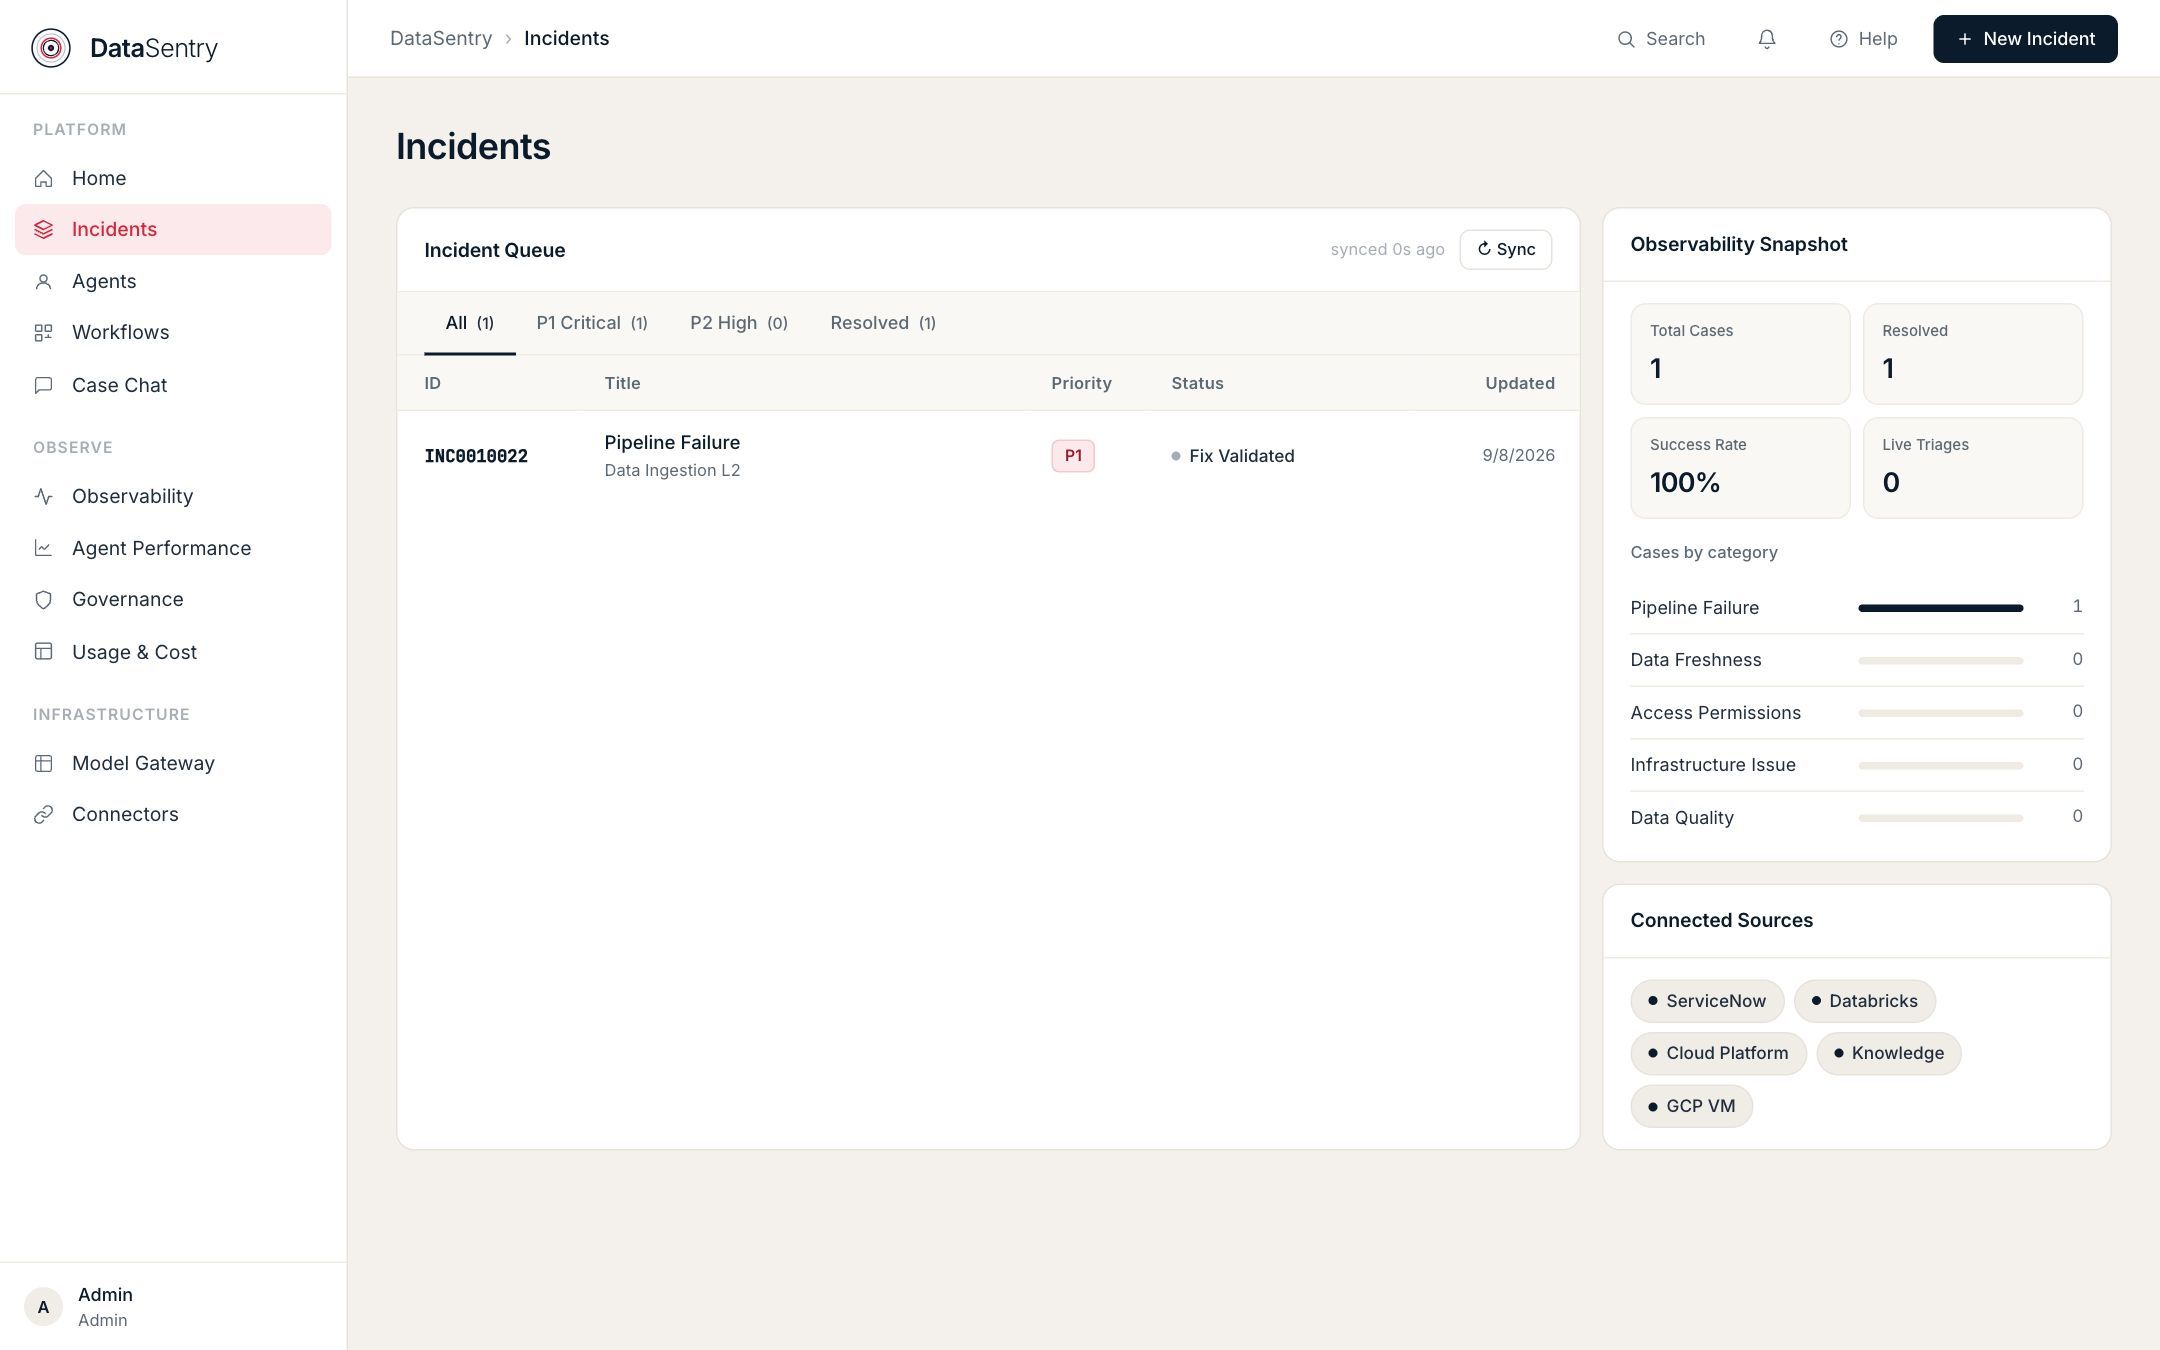
DataSentry Incidents screen showing the incident queue, with case counts by category and connected sources in a side panelDataSentry Incidents screen showing the incident queue, with case counts by category and connected sources in a side panel

Incidents

Every ticket that entered the system, what it was classified as, which team it went to, and where it ended up.

  • ✓ Filter the queue by priority or status
  • ✓ See case counts by category and which sources are connected
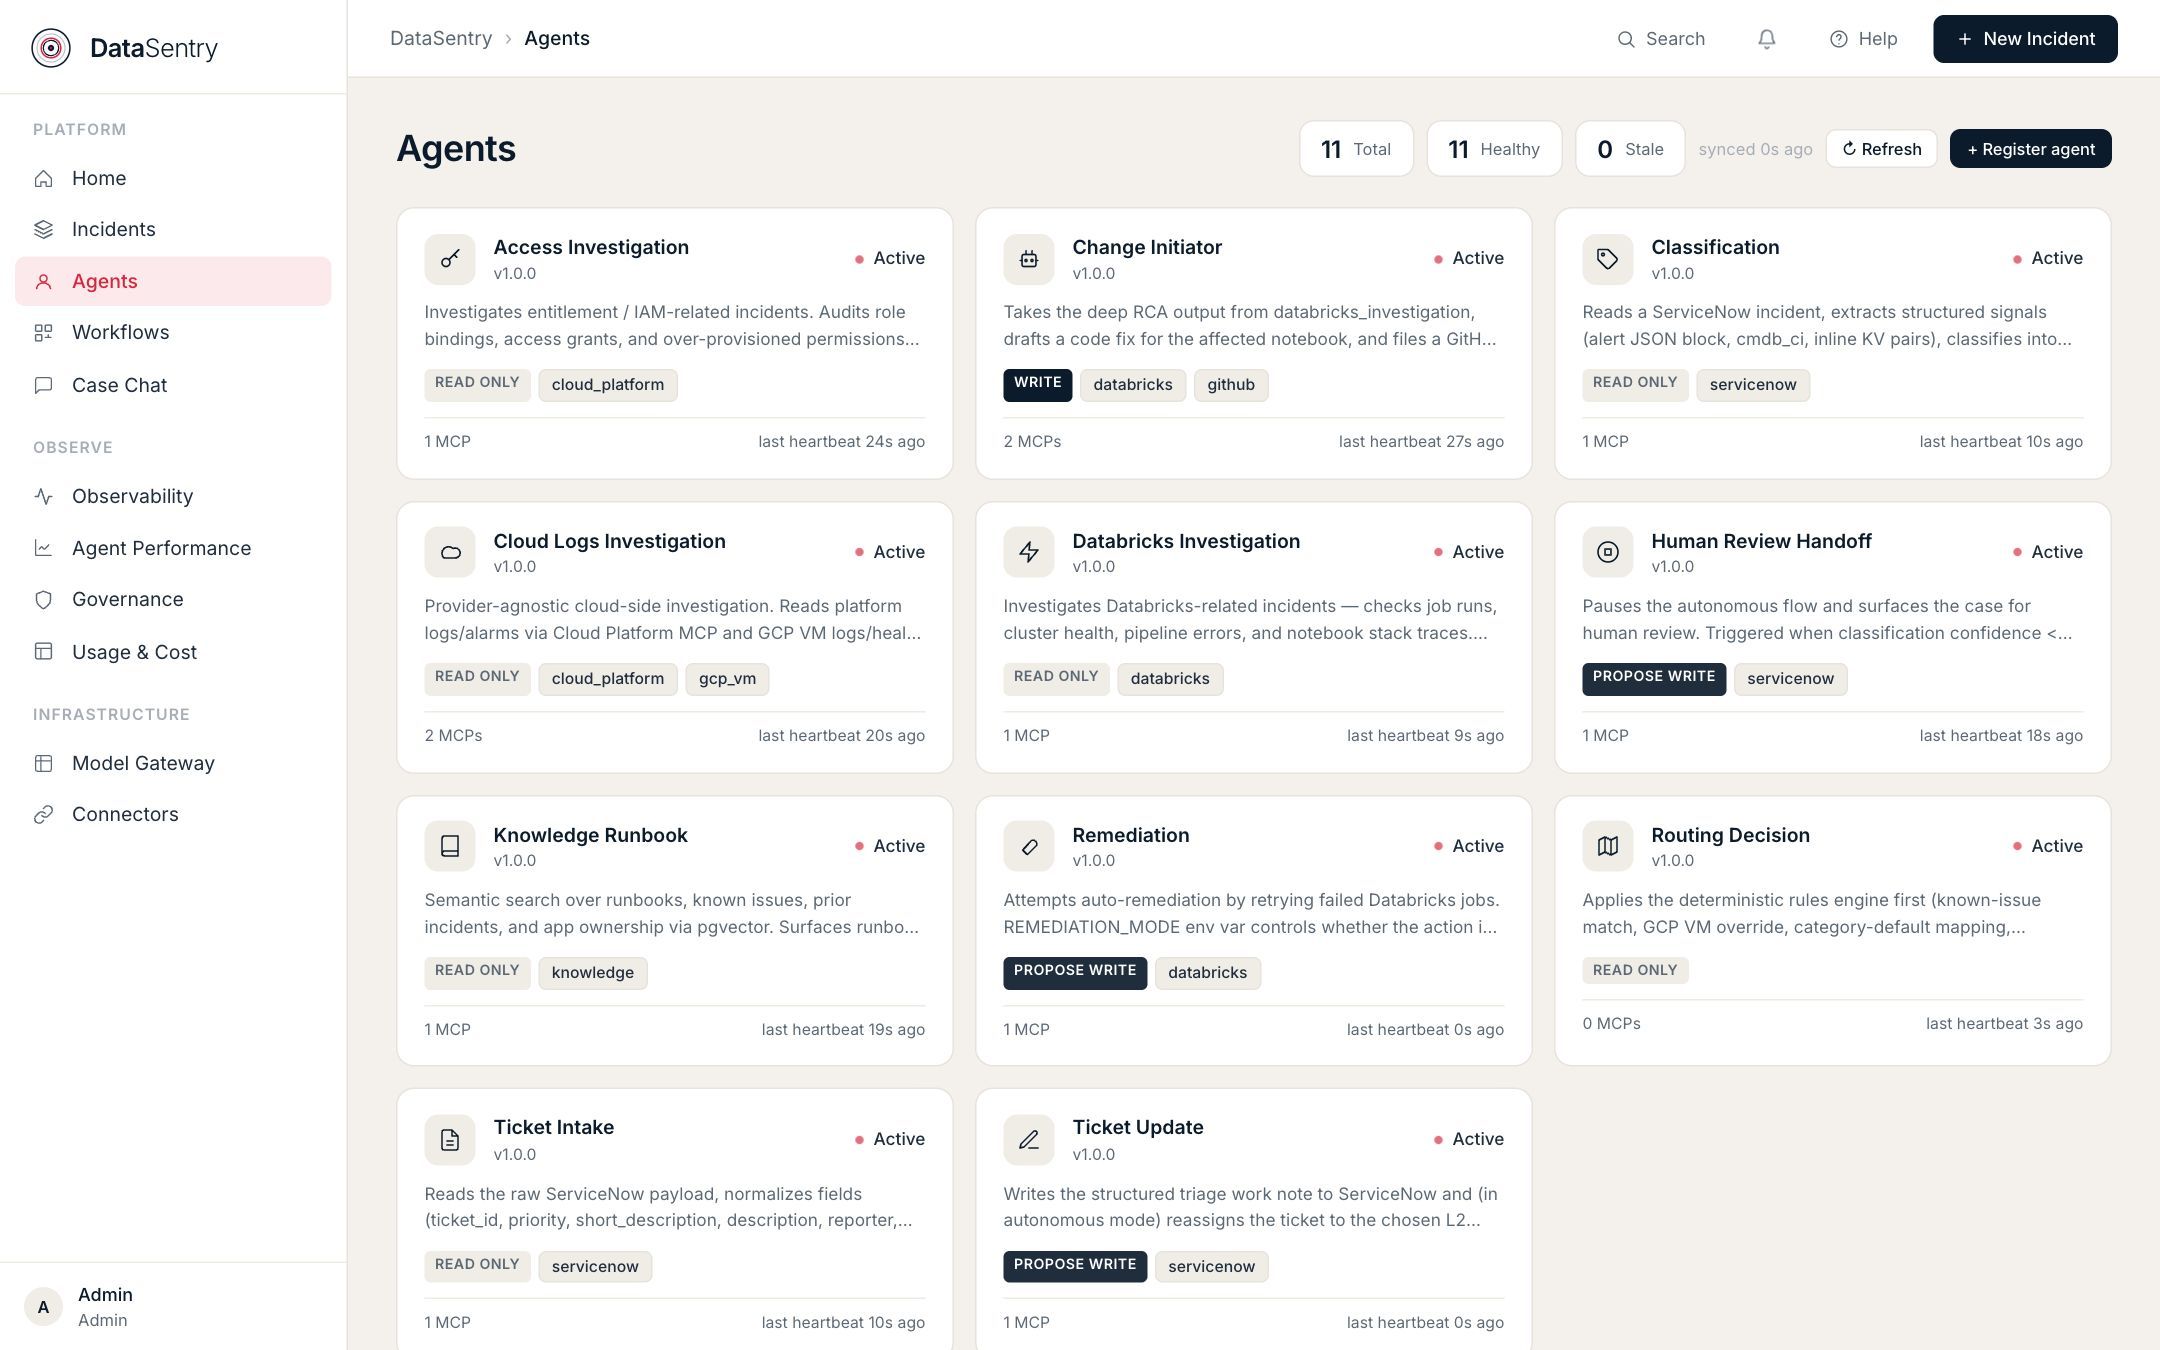
DataSentry Agents screen with a card for each specialist agent, showing its access level and connectorsDataSentry Agents screen with a card for each specialist agent, showing its access level and connectors

Agents

Specialist agents and their health. Each owns one job, such as classification, routing, Databricks investigation, remediation, or ticket updates.

  • ✓ Eleven agents run in the deployment shown, each with a live heartbeat
  • ✓ Each agent card shows its access level and the MCP connectors it uses
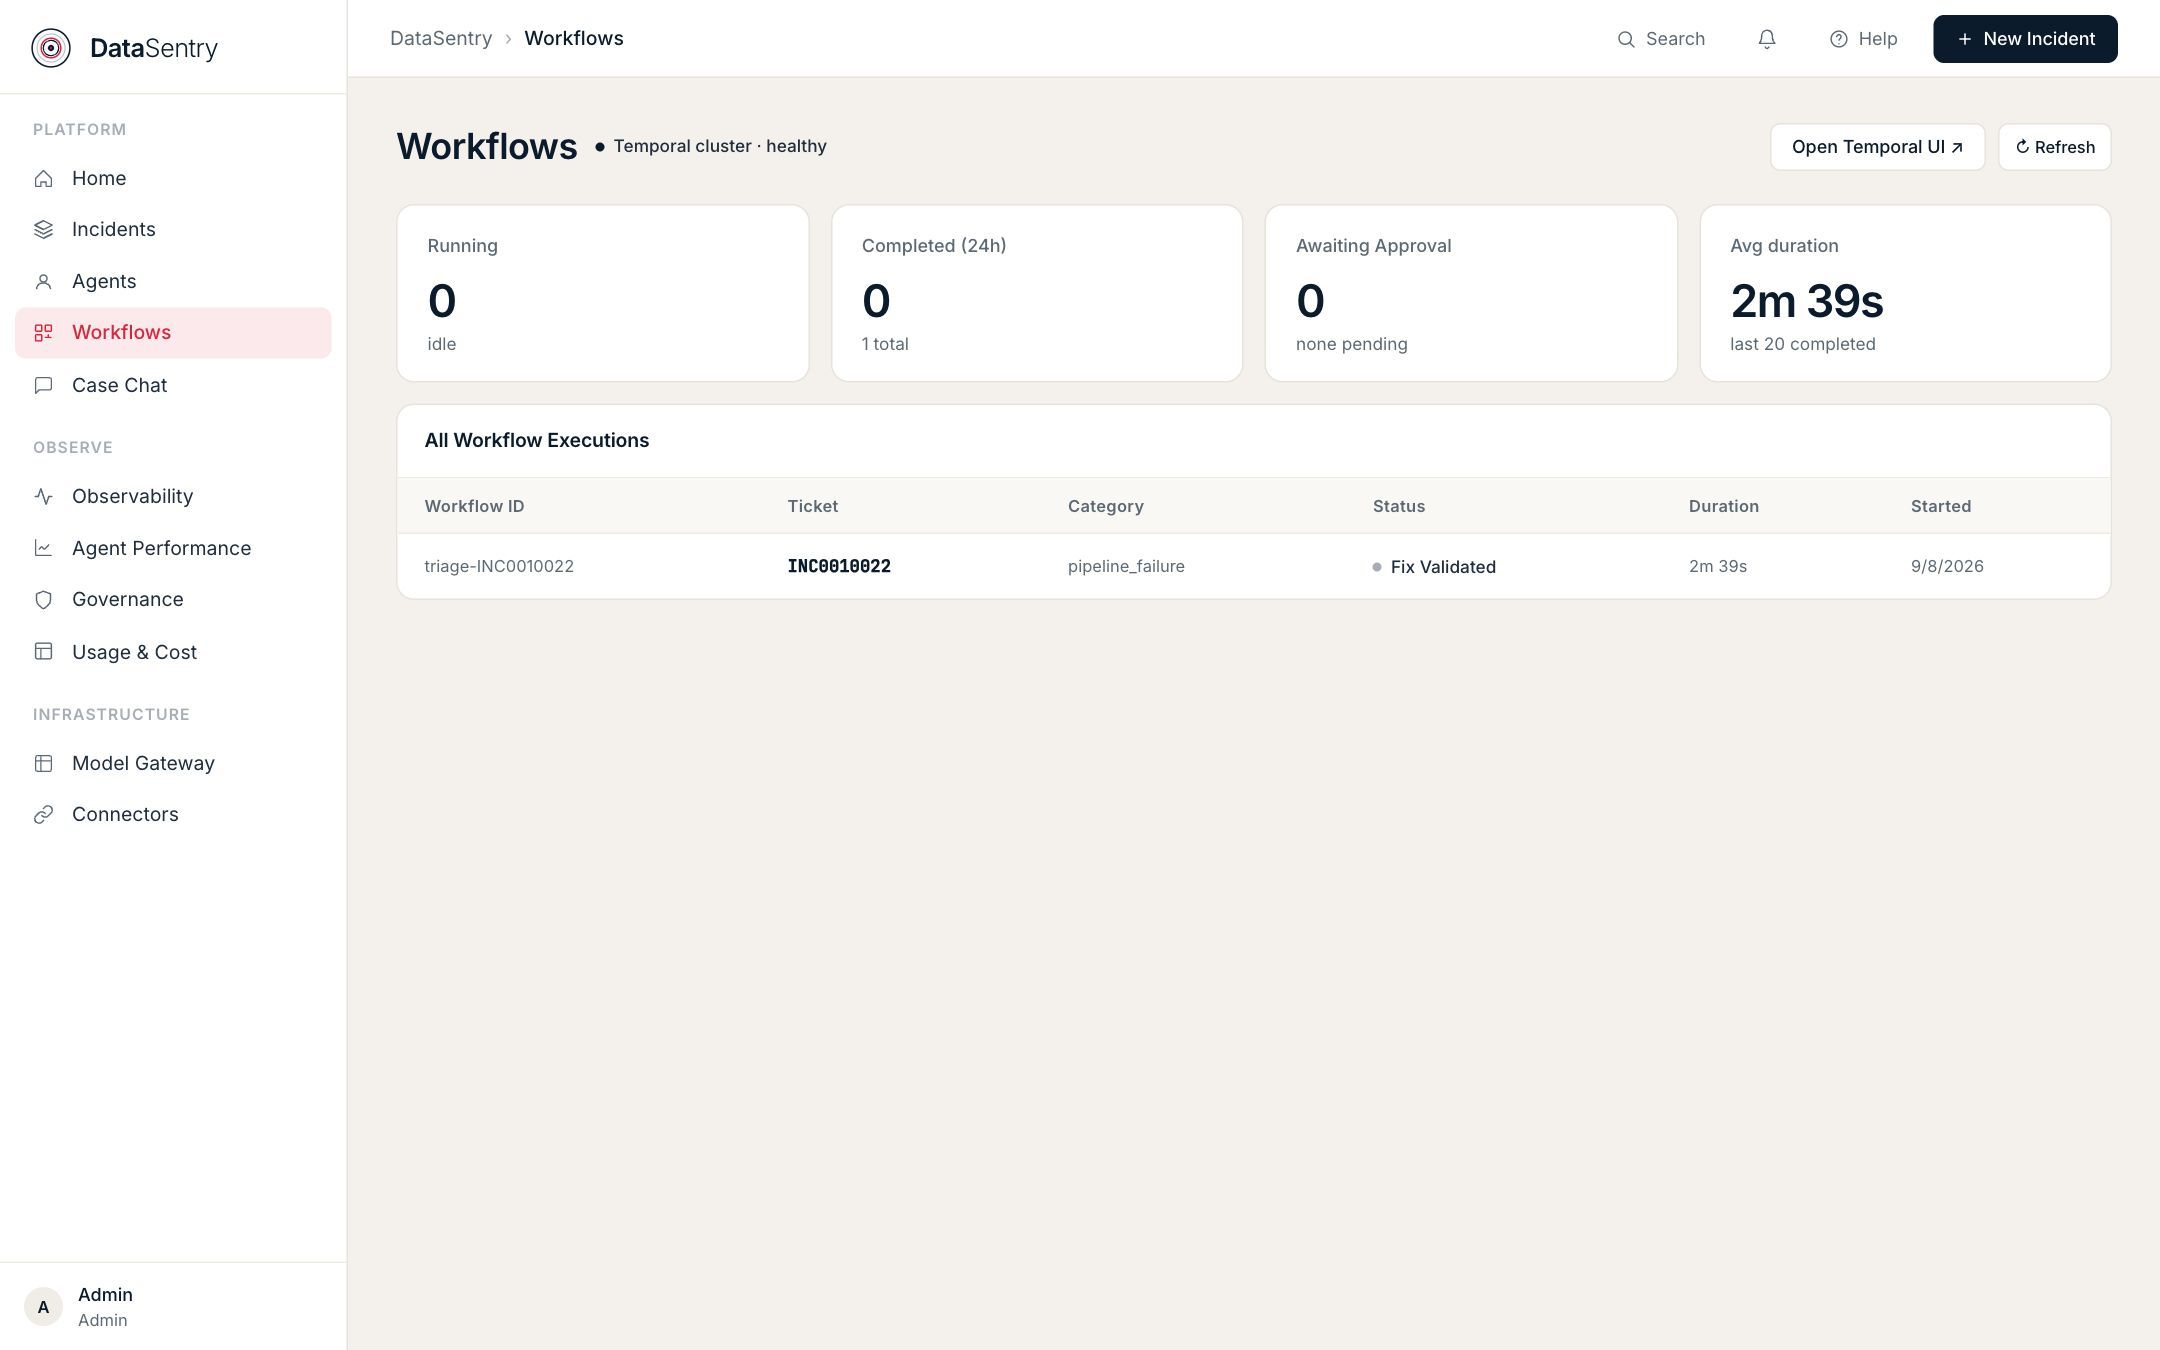
DataSentry Workflows screen with running, completed, awaiting-approval, and average-duration counts above the list of workflow executionsDataSentry Workflows screen with running, completed, awaiting-approval, and average-duration counts above the list of workflow executions

Workflows

The durable pipelines that execute each triage. See which step a run reached, and where it retried or stopped.

  • ✓ Runs on a Temporal workflow engine with durable state
  • ✓ Runs waiting for a human approval are counted on the same screen
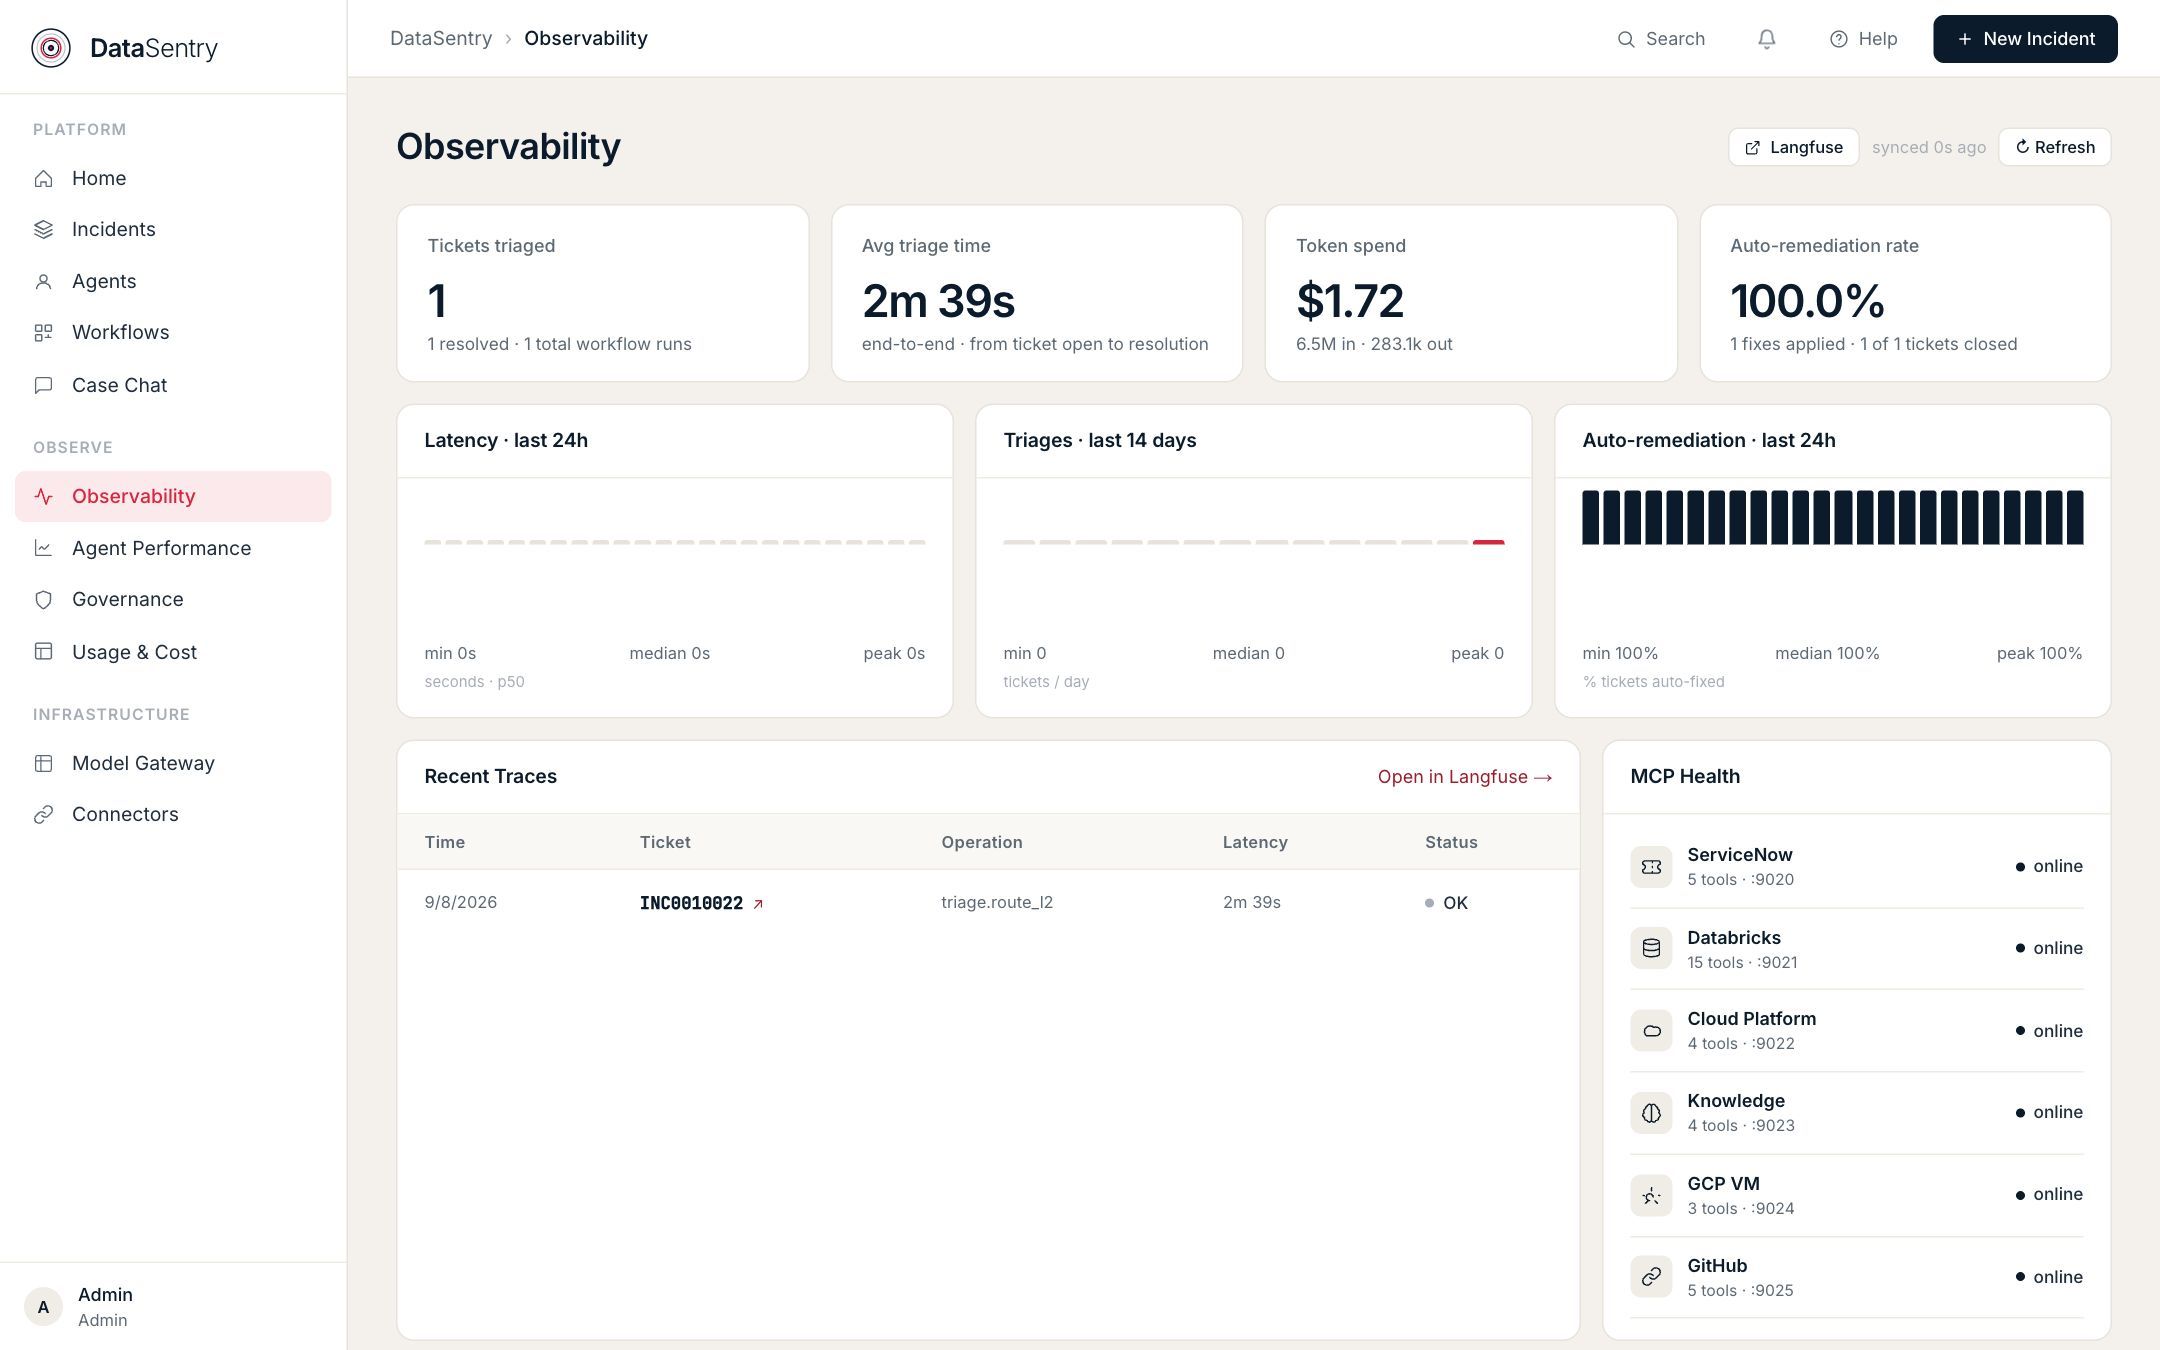
DataSentry Observability screen with tickets triaged, average triage time, token spend, auto-remediation rate, recent traces, and MCP healthDataSentry Observability screen with tickets triaged, average triage time, token spend, auto-remediation rate, recent traces, and MCP health

Observability

Live health of the whole system: tickets triaged, end-to-end triage time, token spend, and recent traces.

  • ✓ Open any trace in Langfuse
  • ✓ MCP health for every connected system, from ServiceNow to GitHub
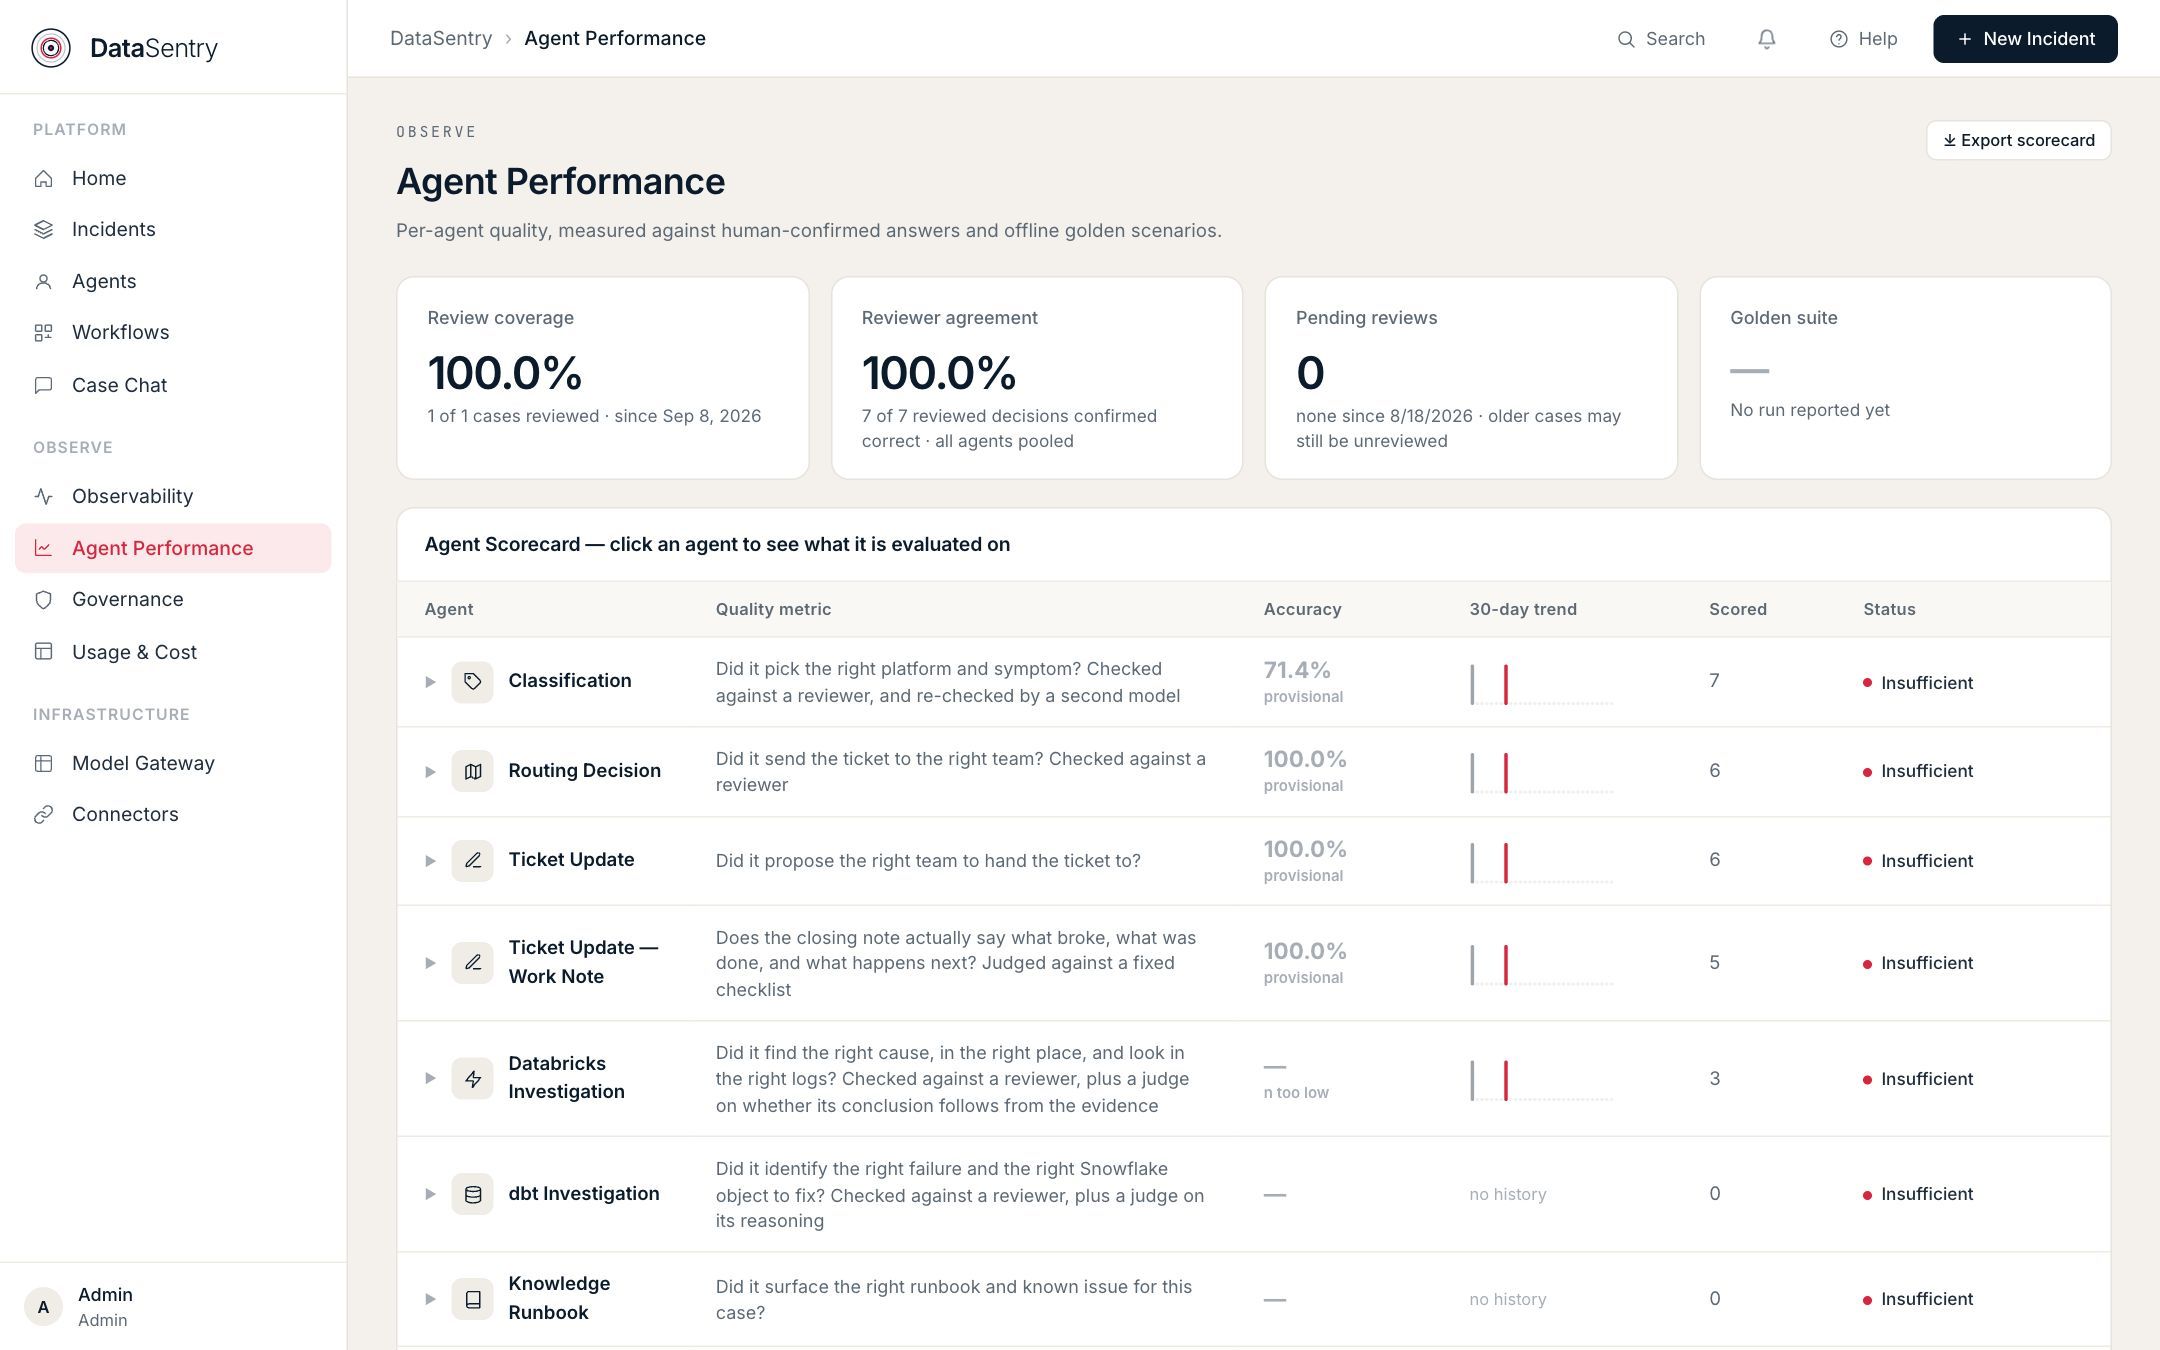
DataSentry Agent Performance screen with a per-agent accuracy scorecardDataSentry Agent Performance screen with a per-agent accuracy scorecard

Agent Performance

A scorecard for every agent, with its accuracy and 30-day trend.

  • ✓ Each agent is scored on a plain question, such as "Did it send the ticket to the right team?"
  • ✓ Export the scorecard for review
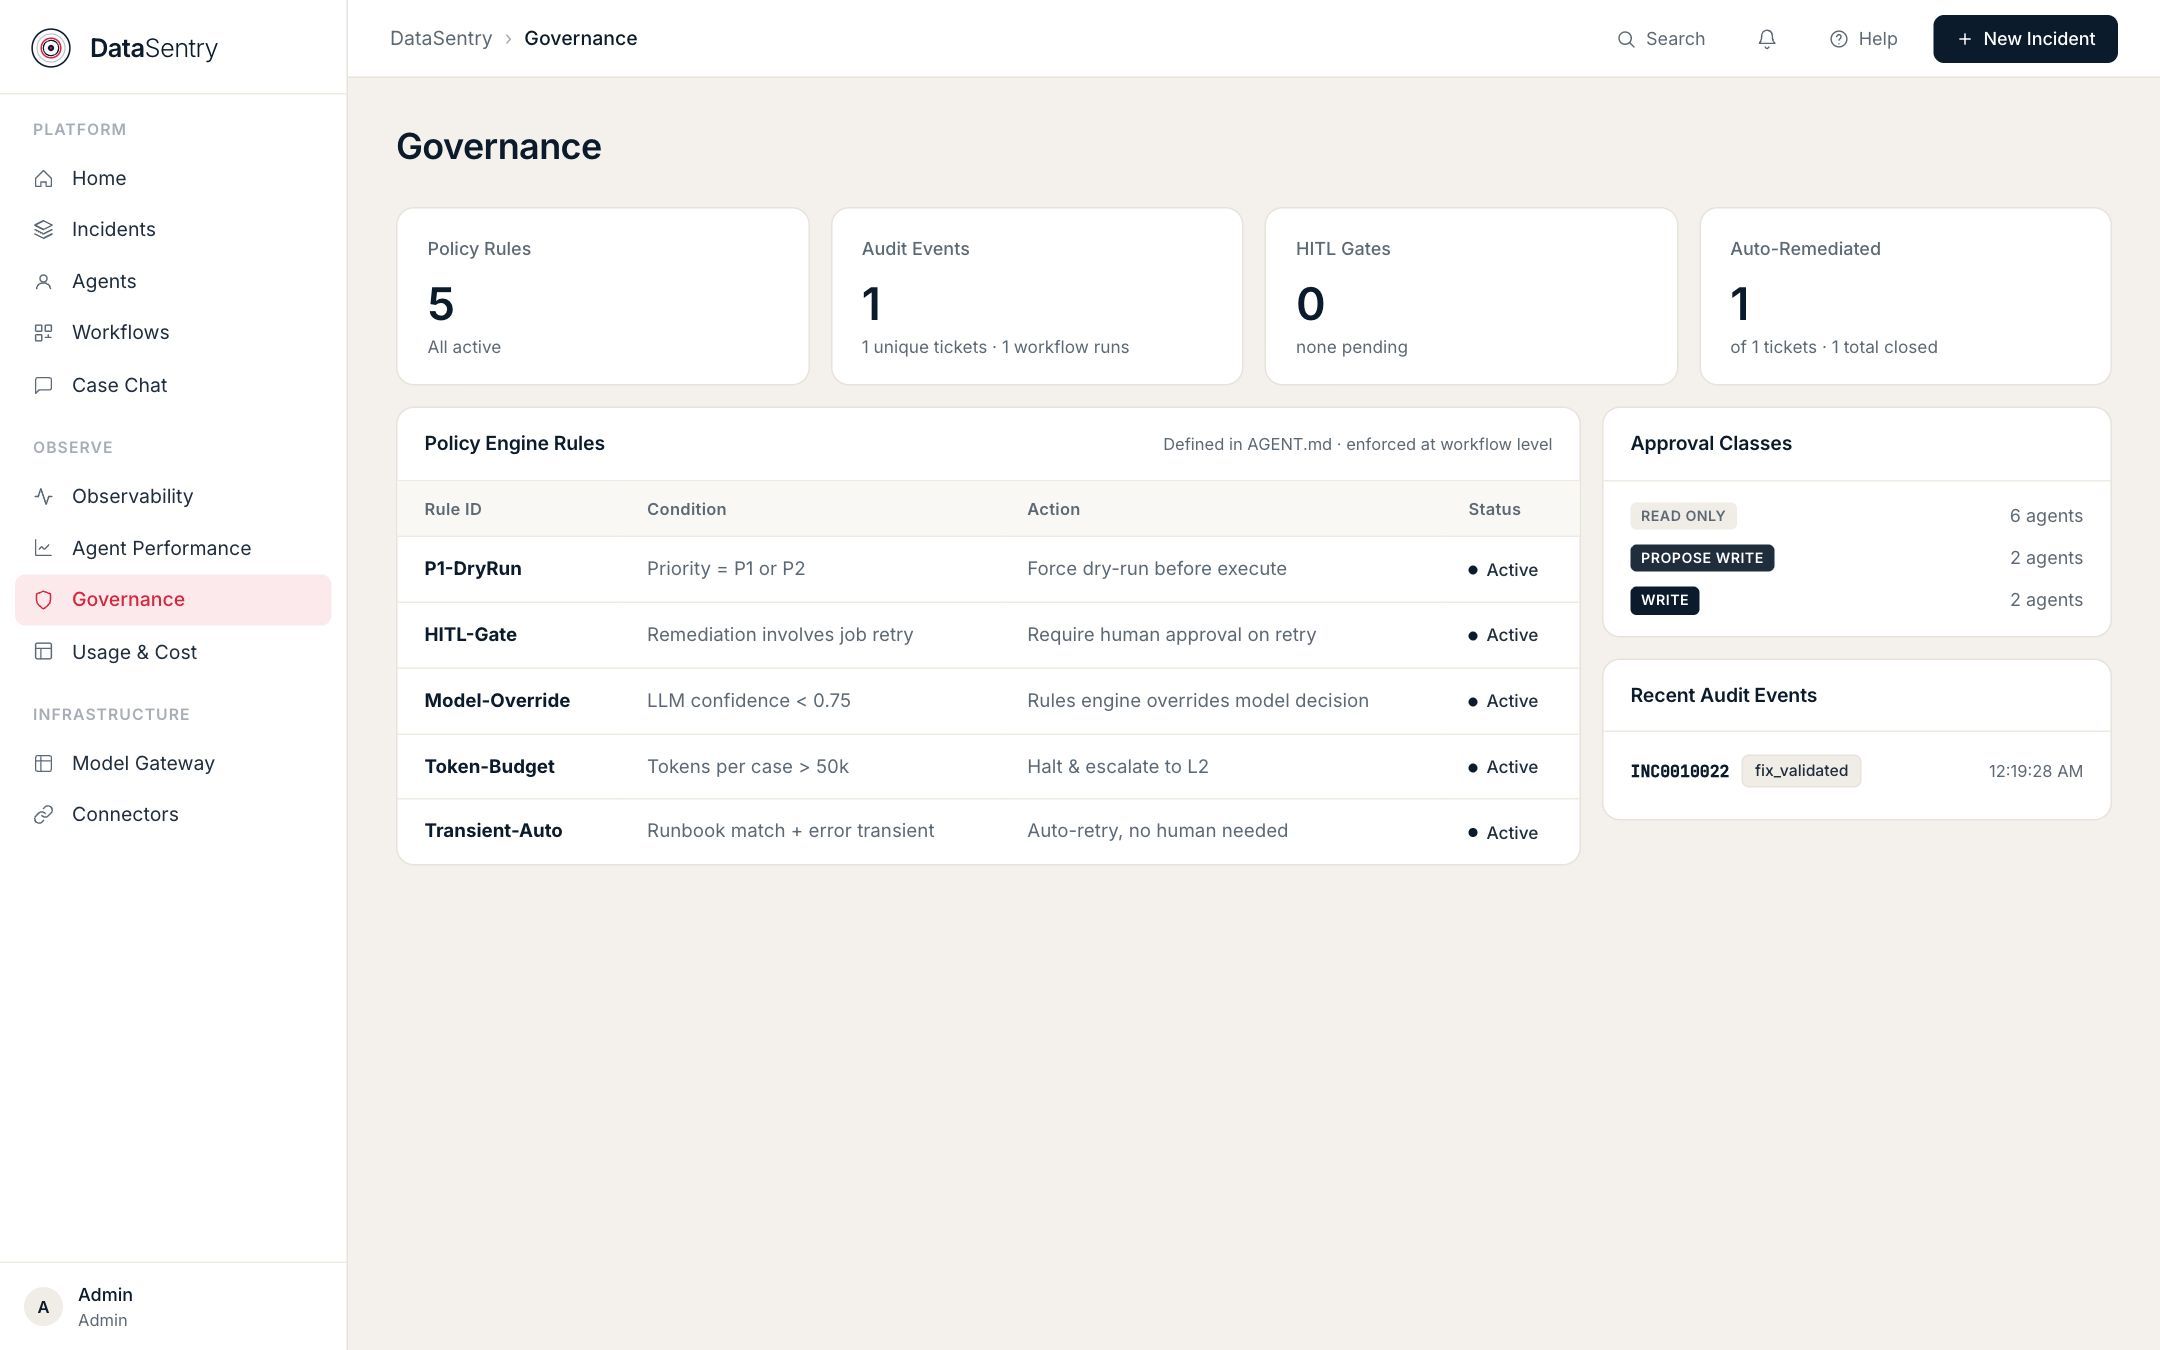
DataSentry Governance screen with the policy engine rules and recent audit eventsDataSentry Governance screen with the policy engine rules and recent audit events

Governance

See the active policy rules and every case waiting for a human decision.

  • ✓ Recent audit events, with the ticket and the action taken
  • ✓ Approval classes show how many agents can only read and how many can write
Platform

An Architecture Built for Autonomous, Governed Operations

A durable workflow engine coordinates specialist agents. They reach your systems through MCP connectors, and your chosen language models through a model-agnostic proxy.

LayerWhat It Does
Control PlaneA Temporal workflow engine runs each incident as a durable workflow, with human approval checkpoints where policy requires them. Its workflow UI lets you step through any run to debug it.
Agents PlaneSpecialist agents, dispatched agent to agent (A2A) through the workflow engine. Examples include ticket intake, classification, Databricks investigation, and remediation.
LLM Proxy LayerA model-agnostic gateway. Swap providers through configuration, with automatic failover when a provider hits a rate limit.
Platform ServicesAgent registry, skill catalog, policy engine, and case chat.
ObservabilityLangfuse traces every prompt and its token cost. OpenTelemetry feeds latency and error-rate dashboards against your SLOs.
Integration LayerMCP connectors and webhooks. The deployment shown connects ServiceNow, Databricks, a cloud platform, a GCP VM, GitHub, and a knowledge base.
Agent Quality

Every Agent Decision Is Scored

You can see where to trust automation and where to keep a person involved.

Human-Confirmed Accuracy

Reviewers confirm whether each agent was right, and accuracy is the exact-match rate against their verdicts.

Shadow Mode

An agent can propose a routing target without applying it, so you can score its decisions before you trust it to act.

Golden Scenarios

Offline test scenarios replay fixed model replies through the real agent code. When one fails, the cause is in the code.

Governance

Automation With the Guardrails in Place

Policies are defined in one place and enforced at the workflow level. Every action is logged as it happens.

RuleConditionAction
P1-DryRunPriority is P1 or P2Force a dry run before execution
HITL-GateRemediation involves a job retryRequire human approval
Model-OverrideModel confidence below 0.75Rules engine overrides the model decision
Token-BudgetTokens per case above 50,000Halt and escalate to L2
Transient-AutoRunbook match and a transient errorRetry automatically, with no human needed
Read Only

Agents that inspect and classify. They cannot change anything.

Propose Write

Agents that suggest a change for a person or a policy to approve.

Write

Agents that apply governed fixes, such as opening a pull request, inside the policy limits.

Business Impact

What Changes for Your Data Team

TodayWith DataSentry™
Alert fatigue. Engineers triage hundreds of noisy alerts by hand every day.Signal filtered automatically. Noise is suppressed before it reaches a person, and only real incidents escalate.
Hours to resolve. Investigation spans siloed tools, so MTTR is measured in hours.Faster MTTR. Specialist agents investigate in parallel and resolve common incidents end to end.
Runbooks in wikis. Nobody follows them, so every response is improvised.Runbooks enforced in the workflow. Each step follows the runbook, so every response to an incident class is the same.
Actions in chat. No audit trail, so compliance scrambles after every incident.Full audit trail by default. Every action is logged, so the evidence is ready when compliance asks, with no extra work.
Design target: more than 50% faster MTTR for common, repeatable incident classes. We start with the low-complexity, high-volume incidents that take the most engineer time.

Outcome figures are design targets and have not been measured in a production deployment.

See DataSentry Resolve an Incident

Book a walkthrough and watch a failed pipeline go from ticket to verified fix.